| Name: TAS2R39 | Sequence: fasta or formatted (338aa) | NCBI GI: 116875819 | |
|
Description: taste receptor, type 2, member 39
|
Referenced in:
| ||
|
Composition:
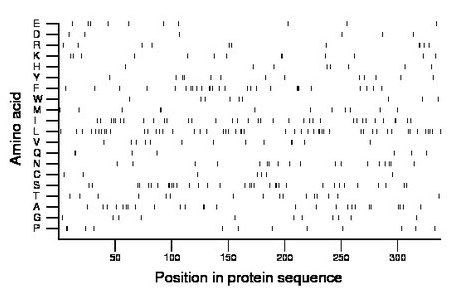
Amino acid Percentage Count Longest homopolymer A alanine 7.7 26 2 C cysteine 2.1 7 1 D aspartate 1.8 6 1 E glutamate 3.0 10 1 F phenylalanine 8.0 27 3 G glycine 3.3 11 1 H histidine 2.4 8 1 I isoleucine 10.4 35 2 K lysine 3.8 13 2 L leucine 14.8 50 2 M methionine 3.6 12 2 N asparagine 5.3 18 2 P proline 3.6 12 2 Q glutamine 2.1 7 2 R arginine 3.3 11 2 S serine 10.1 34 2 T threonine 4.7 16 1 V valine 3.8 13 2 W tryptophan 2.7 9 1 Y tyrosine 3.8 13 2 |
Comparative genomics:
Search single species RefSeq proteins at NCBI
Search summary 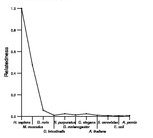
Figure data | ||
Related human proteins:Protein Relative score Description Self-match 1.000 taste receptor, type 2, member 39 TAS2R40 0.502 taste receptor, type 2, member 40 TAS2R7 0.198 taste receptor, type 2, member 7 TAS2R8 0.196 taste receptor, type 2, member 8 TAS2R9 0.184 taste receptor, type 2, member 9 TAS2R4 0.173 taste receptor T2R4 TAS2R13 0.170 taste receptor, type 2, member 13 TAS2R42 0.167 taste receptor, type 2, member 42 TAS2R3 0.167 taste receptor T2R3 TAS2R1 0.164 taste receptor T2R1 TAS2R41 0.164 taste receptor, type 2, member 41 TAS2R10 0.164 taste receptor, type 2, member 10 TAS2R14 0.159 taste receptor, type 2, member 14 TAS2R60 0.152 taste receptor, type 2, member 60 TAS2R30 0.149 type 2 taste receptor member 30 TAS2R46 0.149 taste receptor, type 2, member 46 TAS2R31 0.149 taste receptor, type 2, member 31 TAS2R43 0.144 taste receptor, type 2, member 43 TAS2R38 0.142 taste receptor, type 2, member 38 TAS2R5 0.139 taste receptor T2R5 TAS2R20 0.127 taste receptor, type 2, member 20 TAS2R45 0.126 taste receptor, type 2, member 45 TAS2R16 0.123 taste receptor T2R16 TAS2R19 0.119 taste receptor, type 2, member 19 TAS2R50 0.119 taste receptor, type 2, member 50 OR1S1 0.020 olfactory receptor, family 1, subfamily S, member 1 ... OR1S2 0.018 olfactory receptor, family 1, subfamily S, member 2 ... OPRK1 0.018 opioid receptor, kappa 1 OXER1 0.014 G-protein coupled receptor TG1019 SLC45A1 0.012 DNB5Human BLASTP results (used to prepare the table) | |||
Gene descriptions are from NCBI RefSeq. Search results were obtained with NCBI BLAST and RefSeq entries. When identical proteins are present, the self-match may not be listed first in BLASTP output. In such cases, the table above has been reordered to place it first.
See About the Figures for the scoring system used in the figure above right. The same scoring system was used in the table of BLASTP results.
Guide to the Human Genome
Copyright © 2010 by Stewart Scherer. All rights reserved.
