
| Name: TAS2R60 | Sequence: fasta or formatted (318aa) | NCBI GI: 28973795 | |
|
Description: taste receptor, type 2, member 60
|
Referenced in:
| ||
|
Composition:
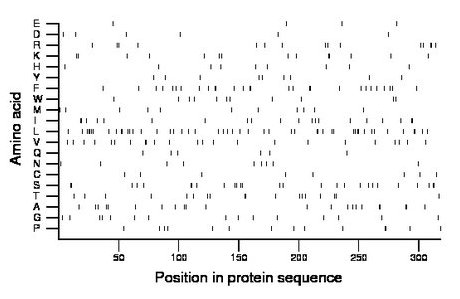
Amino acid Percentage Count Longest homopolymer A alanine 6.9 22 2 C cysteine 2.5 8 1 D aspartate 1.9 6 1 E glutamate 1.3 4 1 F phenylalanine 8.8 28 2 G glycine 4.7 15 1 H histidine 2.8 9 1 I isoleucine 6.3 20 2 K lysine 4.4 14 2 L leucine 15.4 49 4 M methionine 3.5 11 1 N asparagine 2.8 9 1 P proline 4.4 14 2 Q glutamine 1.9 6 1 R arginine 4.7 15 2 S serine 8.5 27 2 T threonine 5.7 18 2 V valine 7.2 23 2 W tryptophan 3.5 11 1 Y tyrosine 2.8 9 1 |
Comparative genomics:
Search single species RefSeq proteins at NCBI
Search summary 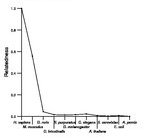
Figure data | ||
Related human proteins:Protein Relative score Description Self-match 1.000 taste receptor, type 2, member 60 TAS2R41 0.338 taste receptor, type 2, member 41 TAS2R16 0.213 taste receptor T2R16 TAS2R7 0.190 taste receptor, type 2, member 7 TAS2R9 0.174 taste receptor, type 2, member 9 TAS2R3 0.166 taste receptor T2R3 TAS2R1 0.165 taste receptor T2R1 TAS2R8 0.165 taste receptor, type 2, member 8 TAS2R40 0.160 taste receptor, type 2, member 40 TAS2R39 0.158 taste receptor, type 2, member 39 TAS2R13 0.136 taste receptor, type 2, member 13 TAS2R5 0.136 taste receptor T2R5 TAS2R43 0.130 taste receptor, type 2, member 43 TAS2R30 0.125 type 2 taste receptor member 30 TAS2R46 0.123 taste receptor, type 2, member 46 TAS2R31 0.120 taste receptor, type 2, member 31 TAS2R20 0.120 taste receptor, type 2, member 20 TAS2R10 0.120 taste receptor, type 2, member 10 TAS2R42 0.118 taste receptor, type 2, member 42 TAS2R4 0.118 taste receptor T2R4 TAS2R45 0.117 taste receptor, type 2, member 45 TAS2R50 0.099 taste receptor, type 2, member 50 TAS2R38 0.098 taste receptor, type 2, member 38 TAS2R14 0.093 taste receptor, type 2, member 14 TAS2R19 0.091 taste receptor, type 2, member 19 ALG10B 0.021 asparagine-linked glycosylation 10 homolog B ALG10 0.016 asparagine-linked glycosylation 10 homolog (yeast, ... HRH2 0.013 histamine receptor H2 isoform 1 HRH2 0.013 histamine receptor H2 isoform 2 ANO6 0.013 anoctamin 6 isoform cHuman BLASTP results (used to prepare the table) | |||
Gene descriptions are from NCBI RefSeq. Search results were obtained with NCBI BLAST and RefSeq entries. When identical proteins are present, the self-match may not be listed first in BLASTP output. In such cases, the table above has been reordered to place it first.
See About the Figures for the scoring system used in the figure above right. The same scoring system was used in the table of BLASTP results.
Guide to the Human Genome
Copyright © 2010 by Stewart Scherer. All rights reserved.
