| Name: TAS2R3 | Sequence: fasta or formatted (316aa) | NCBI GI: 8394398 | |
|
Description: taste receptor T2R3
|
Referenced in:
| ||
|
Composition:
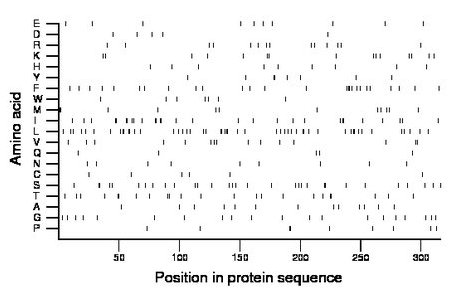
Amino acid Percentage Count Longest homopolymer A alanine 4.1 13 1 C cysteine 1.9 6 1 D aspartate 1.6 5 1 E glutamate 3.2 10 1 F phenylalanine 8.2 26 3 G glycine 6.3 20 1 H histidine 2.8 9 1 I isoleucine 9.2 29 2 K lysine 4.7 15 2 L leucine 15.8 50 3 M methionine 3.8 12 2 N asparagine 2.8 9 1 P proline 2.8 9 2 Q glutamine 1.6 5 1 R arginine 4.4 14 1 S serine 9.8 31 2 T threonine 7.3 23 2 V valine 4.7 15 2 W tryptophan 2.2 7 1 Y tyrosine 2.5 8 2 |
Comparative genomics:
Search single species RefSeq proteins at NCBI
Search summary 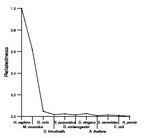
Figure data | ||
Related human proteins:Protein Relative score Description Self-match 1.000 taste receptor T2R3 TAS2R7 0.367 taste receptor, type 2, member 7 TAS2R8 0.356 taste receptor, type 2, member 8 TAS2R9 0.346 taste receptor, type 2, member 9 TAS2R10 0.283 taste receptor, type 2, member 10 TAS2R42 0.265 taste receptor, type 2, member 42 TAS2R13 0.242 taste receptor, type 2, member 13 TAS2R43 0.239 taste receptor, type 2, member 43 TAS2R20 0.234 taste receptor, type 2, member 20 TAS2R46 0.232 taste receptor, type 2, member 46 TAS2R30 0.231 type 2 taste receptor member 30 TAS2R31 0.222 taste receptor, type 2, member 31 TAS2R14 0.221 taste receptor, type 2, member 14 TAS2R45 0.216 taste receptor, type 2, member 45 TAS2R41 0.216 taste receptor, type 2, member 41 TAS2R19 0.214 taste receptor, type 2, member 19 TAS2R50 0.209 taste receptor, type 2, member 50 TAS2R1 0.204 taste receptor T2R1 TAS2R38 0.196 taste receptor, type 2, member 38 TAS2R4 0.180 taste receptor T2R4 TAS2R39 0.180 taste receptor, type 2, member 39 TAS2R40 0.178 taste receptor, type 2, member 40 TAS2R60 0.171 taste receptor, type 2, member 60 TAS2R5 0.158 taste receptor T2R5 TAS2R16 0.152 taste receptor T2R16 RRH 0.013 peropsin GPR183 0.012 EBV-induced G protein-coupled receptor 2 OR13C2 0.010 olfactory receptor, family 13, subfamily C, member 2... ADORA1 0.010 adenosine A1 receptor ADORA1 0.010 adenosine A1 receptorHuman BLASTP results (used to prepare the table) | |||
Gene descriptions are from NCBI RefSeq. Search results were obtained with NCBI BLAST and RefSeq entries. When identical proteins are present, the self-match may not be listed first in BLASTP output. In such cases, the table above has been reordered to place it first.
See About the Figures for the scoring system used in the figure above right. The same scoring system was used in the table of BLASTP results.
Guide to the Human Genome
Copyright © 2010 by Stewart Scherer. All rights reserved.
