| Name: HOMER2 | Sequence: fasta or formatted (299aa) | NCBI GI: 110349797 | |
|
Description: homer 2 isoform 4
|
Referenced in:
| ||
Other entries for this name:
alt prot [288aa] homer 2 isoform 3 alt prot [343aa] homer 2 isoform 1 alt prot [354aa] homer 2 isoform 2 | |||
|
Composition:
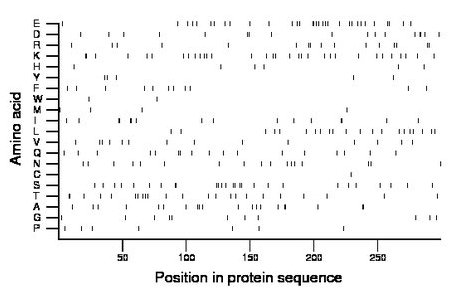
Amino acid Percentage Count Longest homopolymer A alanine 6.7 20 2 C cysteine 0.3 1 1 D aspartate 5.7 17 2 E glutamate 10.7 32 2 F phenylalanine 3.7 11 1 G glycine 3.7 11 1 H histidine 2.0 6 1 I isoleucine 5.4 16 2 K lysine 10.7 32 2 L leucine 7.0 21 1 M methionine 1.3 4 1 N asparagine 5.7 17 1 P proline 2.3 7 1 Q glutamine 5.7 17 2 R arginine 5.4 16 2 S serine 9.0 27 2 T threonine 7.7 23 2 V valine 4.7 14 1 W tryptophan 0.7 2 1 Y tyrosine 1.7 5 1 |
Comparative genomics:
Search single species RefSeq proteins at NCBI
Search summary 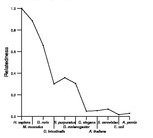
Figure data | ||
Related human proteins:Protein Relative score Description Self-match 1.000 homer 2 isoform 4 HOMER2 0.947 homer 2 isoform 3 HOMER2 0.938 homer 2 isoform 2 HOMER2 0.884 homer 2 isoform 1 HOMER1 0.483 homer 1 HOMER3 0.385 Homer, neuronal immediate early gene, 3 isoform 2 [... HOMER3 0.383 Homer, neuronal immediate early gene, 3 isoform 1 [... HOMER3 0.383 Homer, neuronal immediate early gene, 3 isoform 1 [... HOMER3 0.314 Homer, neuronal immediate early gene, 3 isoform 3 [... ENAH 0.078 enabled homolog isoform a ENAH 0.078 enabled homolog isoform b CCDC88A 0.057 coiled-coil domain containing 88A isoform 2 CCDC88A 0.057 coiled-coil domain containing 88A isoform 1 CIT 0.050 citron EVL 0.050 Enah/Vasp-like INCENP 0.050 inner centromere protein antigens 135/155kDa isofor... INCENP 0.050 inner centromere protein antigens 135/155kDa isofor... CGN 0.048 cingulin VASP 0.048 vasodilator-stimulated phosphoprotein C14orf145 0.046 hypothetical protein LOC145508 PPP1R12A 0.046 protein phosphatase 1, regulatory (inhibitor) subun... PPP1R12A 0.046 protein phosphatase 1, regulatory (inhibitor) subun... PPP1R12A 0.046 protein phosphatase 1, regulatory (inhibitor) subunit... TPM1 0.046 tropomyosin 1 alpha chain isoform 3 TPM3 0.045 tropomyosin 3 isoform 1 JAKMIP3 0.045 Janus kinase and microtubule interacting protein 3 ... TPM1 0.045 tropomyosin 1 alpha chain isoform 2 MYH10 0.045 myosin, heavy polypeptide 10, non-muscle TPM1 0.043 tropomyosin 1 alpha chain isoform 1 NUMA1 0.043 nuclear mitotic apparatus protein 1Human BLASTP results (used to prepare the table) | |||
Gene descriptions are from NCBI RefSeq. Search results were obtained with NCBI BLAST and RefSeq entries. When identical proteins are present, the self-match may not be listed first in BLASTP output. In such cases, the table above has been reordered to place it first.
See About the Figures for the scoring system used in the figure above right. The same scoring system was used in the table of BLASTP results.
Guide to the Human Genome
Copyright © 2010 by Stewart Scherer. All rights reserved.
