| Name: HOMER1 | Sequence: fasta or formatted (354aa) | NCBI GI: 4759198 | |
|
Description: homer 1
|
Referenced in:
| ||
|
Composition:
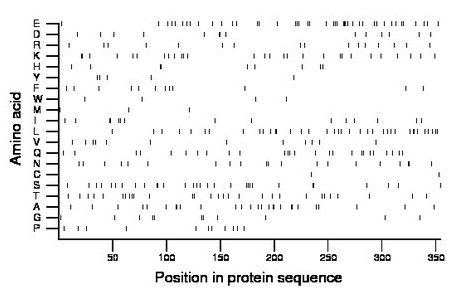
Amino acid Percentage Count Longest homopolymer A alanine 7.6 27 2 C cysteine 0.6 2 1 D aspartate 4.0 14 2 E glutamate 12.1 43 3 F phenylalanine 3.4 12 1 G glycine 3.1 11 2 H histidine 2.5 9 2 I isoleucine 4.2 15 2 K lysine 7.9 28 2 L leucine 10.5 37 2 M methionine 0.8 3 1 N asparagine 5.6 20 2 P proline 3.1 11 1 Q glutamine 7.3 26 2 R arginine 4.5 16 1 S serine 8.5 30 2 T threonine 8.2 29 1 V valine 3.4 12 1 W tryptophan 1.1 4 1 Y tyrosine 1.4 5 1 |
Comparative genomics:
Search single species RefSeq proteins at NCBI
Search summary 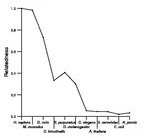
Figure data | ||
Related human proteins:Protein Relative score Description Self-match 1.000 homer 1 HOMER2 0.490 homer 2 isoform 2 HOMER2 0.478 homer 2 isoform 1 HOMER3 0.453 Homer, neuronal immediate early gene, 3 isoform 1 [... HOMER3 0.453 Homer, neuronal immediate early gene, 3 isoform 1 [... HOMER3 0.441 Homer, neuronal immediate early gene, 3 isoform 2 [... HOMER2 0.404 homer 2 isoform 4 HOMER2 0.392 homer 2 isoform 3 HOMER3 0.377 Homer, neuronal immediate early gene, 3 isoform 3 [... AKAP9 0.058 A-kinase anchor protein 9 isoform 3 ERC2 0.051 cytomatrix protein p110 ENAH 0.051 enabled homolog isoform a ENAH 0.051 enabled homolog isoform b AKAP9 0.051 A-kinase anchor protein 9 isoform 2 KIF20B 0.051 M-phase phosphoprotein 1 CCDC123 0.048 coiled-coil domain containing 123 TPM3 0.046 tropomyosin 3 isoform 1 GCC2 0.045 GRIP and coiled-coil domain-containing 2 CENPE 0.045 centromere protein E RRBP1 0.045 ribosome binding protein 1 RRBP1 0.045 ribosome binding protein 1 MYH14 0.045 myosin, heavy chain 14 isoform 1 MYH14 0.045 myosin, heavy chain 14 isoform 2 MYH14 0.045 myosin, heavy chain 14 isoform 3 FKBP15 0.045 FK506 binding protein 15, 133kDa ERC1 0.043 RAB6-interacting protein 2 isoform epsilon ERC1 0.043 RAB6-interacting protein 2 isoform delta CEP250 0.043 centrosomal protein 2 MAD1L1 0.042 MAD1-like 1 protein MAD1L1 0.042 MAD1-like 1 proteinHuman BLASTP results (used to prepare the table) | |||
Gene descriptions are from NCBI RefSeq. Search results were obtained with NCBI BLAST and RefSeq entries. When identical proteins are present, the self-match may not be listed first in BLASTP output. In such cases, the table above has been reordered to place it first.
See About the Figures for the scoring system used in the figure above right. The same scoring system was used in the table of BLASTP results.
Guide to the Human Genome
Copyright © 2010 by Stewart Scherer. All rights reserved.
