| Name: HOMER2 | Sequence: fasta or formatted (343aa) | NCBI GI: 46249349 | |
|
Description: homer 2 isoform 1
|
Referenced in:
| ||
Other entries for this name:
alt prot [288aa] homer 2 isoform 3 alt prot [299aa] homer 2 isoform 4 alt prot [354aa] homer 2 isoform 2 | |||
|
Composition:
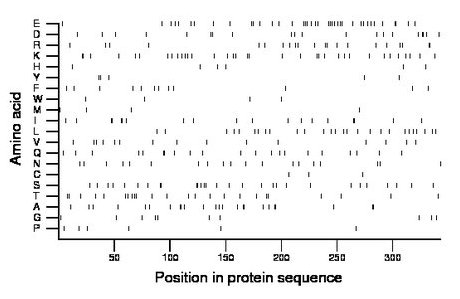
Amino acid Percentage Count Longest homopolymer A alanine 7.0 24 2 C cysteine 0.9 3 1 D aspartate 5.8 20 2 E glutamate 11.4 39 2 F phenylalanine 3.5 12 1 G glycine 2.9 10 1 H histidine 1.7 6 1 I isoleucine 5.5 19 2 K lysine 10.2 35 2 L leucine 7.9 27 1 M methionine 1.2 4 1 N asparagine 5.5 19 1 P proline 1.7 6 1 Q glutamine 6.1 21 2 R arginine 6.1 21 2 S serine 8.5 29 2 T threonine 7.0 24 2 V valine 4.4 15 1 W tryptophan 1.2 4 1 Y tyrosine 1.5 5 1 |
Comparative genomics:
Search single species RefSeq proteins at NCBI
Search summary 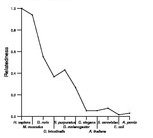
Figure data | ||
Related human proteins:Protein Relative score Description Self-match 1.000 homer 2 isoform 1 HOMER2 0.986 homer 2 isoform 2 HOMER2 0.656 homer 2 isoform 3 HOMER2 0.643 homer 2 isoform 4 HOMER1 0.495 homer 1 HOMER3 0.413 Homer, neuronal immediate early gene, 3 isoform 1 [... HOMER3 0.413 Homer, neuronal immediate early gene, 3 isoform 1 [... HOMER3 0.407 Homer, neuronal immediate early gene, 3 isoform 2 [... HOMER3 0.351 Homer, neuronal immediate early gene, 3 isoform 3 [... KIF20B 0.069 M-phase phosphoprotein 1 ENAH 0.066 enabled homolog isoform a ENAH 0.066 enabled homolog isoform b CGN 0.063 cingulin CCDC88A 0.060 coiled-coil domain containing 88A isoform 2 CCDC88A 0.060 coiled-coil domain containing 88A isoform 1 MYH7 0.059 myosin, heavy chain 7, cardiac muscle, beta MYH11 0.055 smooth muscle myosin heavy chain 11 isoform SM1A [Ho... MYH11 0.055 smooth muscle myosin heavy chain 11 isoform SM1B [Ho... MYH11 0.055 smooth muscle myosin heavy chain 11 isoform SM2B [Ho... MYH11 0.055 smooth muscle myosin heavy chain 11 isoform SM2A [Ho... CLIP1 0.054 restin isoform b CLIP1 0.054 restin isoform a MYH6 0.052 myosin heavy chain 6 MYH4 0.052 myosin, heavy polypeptide 4, skeletal muscle FILIP1 0.052 filamin A interacting protein 1 CENPE 0.051 centromere protein E TPR 0.049 nuclear pore complex-associated protein TPR NUMA1 0.049 nuclear mitotic apparatus protein 1 MYH3 0.048 myosin, heavy chain 3, skeletal muscle, embryonic [H... MYH10 0.048 myosin, heavy polypeptide 10, non-muscleHuman BLASTP results (used to prepare the table) | |||
Gene descriptions are from NCBI RefSeq. Search results were obtained with NCBI BLAST and RefSeq entries. When identical proteins are present, the self-match may not be listed first in BLASTP output. In such cases, the table above has been reordered to place it first.
See About the Figures for the scoring system used in the figure above right. The same scoring system was used in the table of BLASTP results.
Guide to the Human Genome
Copyright © 2010 by Stewart Scherer. All rights reserved.
