| Name: DSG4 | Sequence: fasta or formatted (1040aa) | NCBI GI: 29789445 | |
|
Description: desmoglein 4 isoform 2
|
Referenced in: Cadherins and Related Proteins
| ||
Other entries for this name:
alt prot [1059aa] desmoglein 4 isoform 1 | |||
|
Composition:
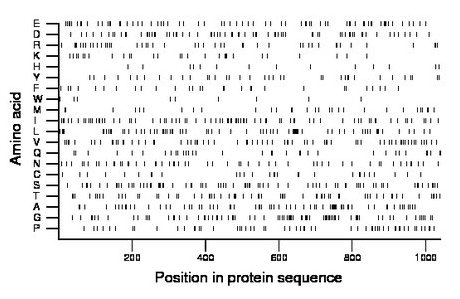
Amino acid Percentage Count Longest homopolymer A alanine 7.0 73 3 C cysteine 2.9 30 3 D aspartate 7.1 74 2 E glutamate 6.9 72 2 F phenylalanine 2.9 30 2 G glycine 7.4 77 2 H histidine 1.3 14 1 I isoleucine 7.7 80 2 K lysine 2.7 28 2 L leucine 7.0 73 5 M methionine 3.1 32 2 N asparagine 5.1 53 2 P proline 5.5 57 2 Q glutamine 3.4 35 2 R arginine 4.3 45 2 S serine 7.7 80 2 T threonine 6.2 65 2 V valine 7.3 76 3 W tryptophan 0.9 9 1 Y tyrosine 3.6 37 1 |
Comparative genomics:
Search single species RefSeq proteins at NCBI
Search summary 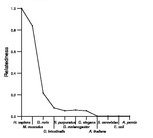
Figure data | ||
Related human proteins:Protein Relative score Description Self-match 1.000 desmoglein 4 isoform 2 DSG4 0.975 desmoglein 4 isoform 1 DSG3 0.446 desmoglein 3 preproprotein DSG2 0.281 desmoglein 2 preproprotein DSG1 0.279 desmoglein 1 preproprotein DSC2 0.163 desmocollin 2 isoform Dsc2a preproprotein DSC3 0.157 desmocollin 3 isoform Dsc3a preproprotein DSC1 0.152 desmocollin 1 isoform Dsc1a preproprotein DSC2 0.143 desmocollin 2 isoform Dsc2b preproprotein CDH4 0.143 cadherin 4, type 1 preproprotein CDH2 0.140 cadherin 2, type 1 preproprotein DSC3 0.137 desmocollin 3 isoform Dsc3b preproprotein DSC1 0.134 desmocollin 1 isoform Dsc1b preproprotein CDH15 0.133 cadherin 15 preproprotein CDH1 0.130 cadherin 1, type 1 preproprotein CDH13 0.122 cadherin 13 preproprotein CDH26 0.119 cadherin-like 26 isoform a CDH3 0.116 cadherin 3, type 1 preproprotein CDH6 0.082 cadherin 6, type 2 preproprotein CDH7 0.081 cadherin 7, type 2 preproprotein CDH7 0.081 cadherin 7, type 2 preproprotein CDH12 0.081 cadherin 12, type 2 preproprotein CDH18 0.079 cadherin 18, type 2 preproprotein CDH20 0.076 cadherin 20, type 2 preproprotein CDH22 0.074 cadherin 22 precursor CDH11 0.073 cadherin 11, type 2 preproprotein CDH17 0.073 cadherin 17 precursor CDH17 0.073 cadherin 17 precursor CDH9 0.072 cadherin 9, type 2 preproprotein CDH10 0.072 cadherin 10, type 2 preproproteinHuman BLASTP results (used to prepare the table) | |||
Gene descriptions are from NCBI RefSeq. Search results were obtained with NCBI BLAST and RefSeq entries. When identical proteins are present, the self-match may not be listed first in BLASTP output. In such cases, the table above has been reordered to place it first.
See About the Figures for the scoring system used in the figure above right. The same scoring system was used in the table of BLASTP results.
Guide to the Human Genome
Copyright © 2010 by Stewart Scherer. All rights reserved.
