| Name: MFAP1 | Sequence: fasta or formatted (439aa) | NCBI GI: 50726968 | |
|
Description: microfibrillar-associated protein 1
|
Referenced in:
| ||
|
Composition:
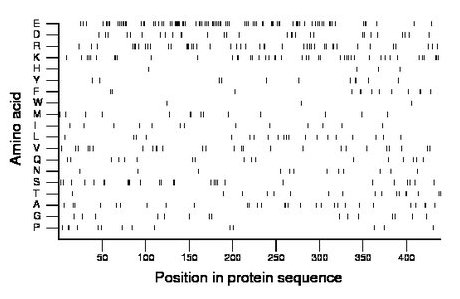
Amino acid Percentage Count Longest homopolymer A alanine 6.6 29 2 C cysteine 0.0 0 0 D aspartate 6.6 29 2 E glutamate 19.8 87 6 F phenylalanine 3.0 13 2 G glycine 3.4 15 1 H histidine 0.9 4 1 I isoleucine 3.0 13 1 K lysine 10.0 44 2 L leucine 4.6 20 1 M methionine 3.2 14 2 N asparagine 2.7 12 1 P proline 3.2 14 2 Q glutamine 3.9 17 1 R arginine 10.0 44 3 S serine 6.2 27 3 T threonine 3.9 17 2 V valine 5.9 26 2 W tryptophan 0.7 3 1 Y tyrosine 2.5 11 2 |
Comparative genomics:
Search single species RefSeq proteins at NCBI
Search summary 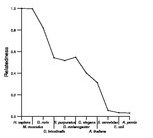
Figure data | ||
Related human proteins:Protein Relative score Description Self-match 1.000 microfibrillar-associated protein 1 TCHH 0.072 trichohyalin LOC727832 0.069 golgi autoantigen, golgin subfamily a-like LOC283767 0.069 golgi autoantigen, golgin subfamily a-like LOC100286959 0.068 PREDICTED: hypothetical protein XP_002343921 LOC283685 0.067 PREDICTED: golgi autoantigen, golgin subfamily a-li... LOC283685 0.067 PREDICTED: golgi autoantigen, golgin subfamily a-li... CALD1 0.066 caldesmon 1 isoform 1 LOC645202 0.066 PREDICTED: hypothetical protein LOC645202 EIF5B 0.064 eukaryotic translation initiation factor 5B LOC440243 0.063 PREDICTED: Putative golgin subfamily A member 6-lik... RBM25 0.062 RNA binding motif protein 25 LOC400352 0.060 PREDICTED: similar to Putative golgin subfamily A m... LOC100132816 0.060 PREDICTED: similar to Putative golgin subfamily A m... NEXN 0.058 nexilin (F actin binding protein) PLEC1 0.057 plectin 1 isoform 11 PLEC1 0.057 plectin 1 isoform 10 PLEC1 0.057 plectin 1 isoform 8 PLEC1 0.057 plectin 1 isoform 7 PLEC1 0.057 plectin 1 isoform 6 PLEC1 0.057 plectin 1 isoform 3 PLEC1 0.057 plectin 1 isoform 2 PLEC1 0.057 plectin 1 isoform 1 TNNT2 0.057 troponin T type 2, cardiac isoform 2 TNNT2 0.056 troponin T type 2, cardiac isoform 4 TNNT2 0.055 troponin T type 2, cardiac isoform 1 WDR87 0.055 NYD-SP11 protein LOC100133758 0.054 PREDICTED: hypothetical protein, partial TNNT2 0.054 troponin T type 2, cardiac isoform 3 GIGYF2 0.053 GRB10 interacting GYF protein 2 isoform cHuman BLASTP results (used to prepare the table) | |||
Gene descriptions are from NCBI RefSeq. Search results were obtained with NCBI BLAST and RefSeq entries. When identical proteins are present, the self-match may not be listed first in BLASTP output. In such cases, the table above has been reordered to place it first.
See About the Figures for the scoring system used in the figure above right. The same scoring system was used in the table of BLASTP results.
Guide to the Human Genome
Copyright © 2010 by Stewart Scherer. All rights reserved.
