
| Name: PGA3 | Sequence: fasta or formatted (388aa) | NCBI GI: 119372298 | |
|
Description: pepsinogen 3, group I
|
Referenced in:
| ||
|
Composition:
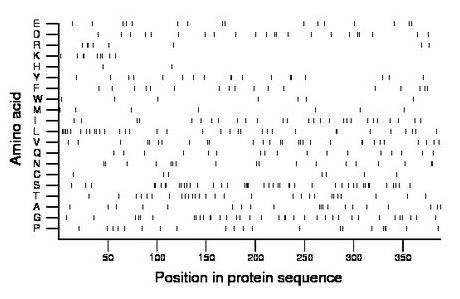
Amino acid Percentage Count Longest homopolymer A alanine 5.2 20 1 C cysteine 1.8 7 1 D aspartate 5.7 22 2 E glutamate 4.1 16 1 F phenylalanine 4.4 17 1 G glycine 9.3 36 2 H histidine 0.5 2 1 I isoleucine 7.0 27 1 K lysine 2.3 9 2 L leucine 9.0 35 4 M methionine 1.8 7 1 N asparagine 4.6 18 2 P proline 5.4 21 2 Q glutamine 4.4 17 1 R arginine 2.1 8 2 S serine 11.3 44 3 T threonine 7.2 28 1 V valine 7.5 29 2 W tryptophan 1.8 7 1 Y tyrosine 4.6 18 2 |
Comparative genomics:
Search single species RefSeq proteins at NCBI
Search summary 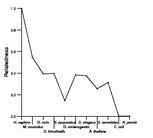
Figure data | ||
Related human proteins:Protein Relative score Description Self-match 1.000 pepsinogen 3, group I PGA4 0.997 pepsinogen 4, group I PGA5 0.992 pepsinogen 5, group I CTSE 0.500 cathepsin E isoform a preproprotein PGC 0.478 progastricsin (pepsinogen C) CTSD 0.403 cathepsin D preproprotein NAPSA 0.343 napsin A preproprotein CTSE 0.319 cathepsin E isoform b preproprotein REN 0.307 renin preproprotein LOC649034 0.176 PREDICTED: similar to pepsinogen 3, group I BACE2 0.098 beta-site APP-cleaving enzyme 2 isoform A preproprot... BACE1 0.094 beta-site APP-cleaving enzyme 1 isoform A preproprote... BACE2 0.093 beta-site APP-cleaving enzyme 2 isoform C preproprot... BACE2 0.091 beta-site APP-cleaving enzyme 2 isoform B preproprot... BACE1 0.084 beta-site APP-cleaving enzyme 1 isoform B preproprot... BACE1 0.062 beta-site APP-cleaving enzyme 1 isoform C preproprot... BACE1 0.054 beta-site APP-cleaving enzyme 1 isoform D preproprot... SMCHD1 0.013 structural maintenance of chromosomes flexible hing... IGSF22 0.012 immunoglobulin superfamily, member 22 APEH 0.009 N-acylaminoacyl-peptide hydrolase BRCA2 0.009 breast cancer 2, early onset NUAK2 0.007 NUAK family, SNF1-like kinase, 2 LHX4 0.007 LIM homeobox protein 4 TRIM24 0.005 transcriptional intermediary factor 1 alpha isoform ... TRIM24 0.005 transcriptional intermediary factor 1 alpha isoform ... TANC2 0.005 tetratricopeptide repeat, ankyrin repeat and coiled...Human BLASTP results (used to prepare the table) | |||
Gene descriptions are from NCBI RefSeq. Search results were obtained with NCBI BLAST and RefSeq entries. When identical proteins are present, the self-match may not be listed first in BLASTP output. In such cases, the table above has been reordered to place it first.
See About the Figures for the scoring system used in the figure above right. The same scoring system was used in the table of BLASTP results.
Guide to the Human Genome
Copyright © 2010 by Stewart Scherer. All rights reserved.
