| Name: PSMC6 | Sequence: fasta or formatted (403aa) | NCBI GI: 195539395 | |
|
Description: proteasome 26S ATPase subunit 6
|
Referenced in:
| ||
|
Composition:
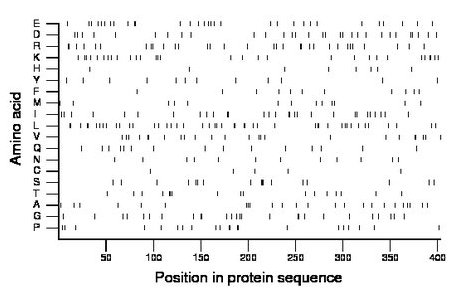
Amino acid Percentage Count Longest homopolymer A alanine 6.0 24 1 C cysteine 1.2 5 1 D aspartate 7.4 30 1 E glutamate 7.7 31 2 F phenylalanine 2.7 11 1 G glycine 6.5 26 2 H histidine 2.0 8 1 I isoleucine 7.2 29 2 K lysine 7.4 30 2 L leucine 11.4 46 2 M methionine 3.2 13 1 N asparagine 3.0 12 1 P proline 5.2 21 2 Q glutamine 3.7 15 1 R arginine 7.9 32 2 S serine 4.2 17 3 T threonine 4.2 17 2 V valine 6.0 24 2 W tryptophan 0.0 0 0 Y tyrosine 3.0 12 1 |
Comparative genomics:
Search single species RefSeq proteins at NCBI
Search summary 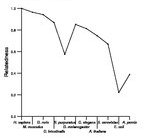
Figure data | ||
Related human proteins:Protein Relative score Description Self-match 1.000 proteasome 26S ATPase subunit 6 PSMC5 0.408 proteasome 26S ATPase subunit 5 PSMC2 0.385 proteasome 26S ATPase subunit 2 PSMC1 0.363 proteasome 26S ATPase subunit 1 LOC652826 0.363 PREDICTED: similar to proteasome 26S ATPase subunit ... PSMC4 0.363 proteasome 26S ATPase subunit 4 isoform 1 PSMC4 0.353 proteasome 26S ATPase subunit 4 isoform 2 PSMC3 0.333 proteasome 26S ATPase subunit 3 LOC345645 0.279 PREDICTED: similar to hCG2002932 LOC345645 0.279 PREDICTED: similar to hCG2002932 LOC345645 0.279 PREDICTED: hypothetical protein LOC345645 SPATA5 0.231 spermatogenesis associated 5 VCP 0.229 valosin-containing protein AFG3L2 0.218 AFG3 ATPase family gene 3-like 2 SPATA5L1 0.205 spermatogenesis associated 5-like 1 SPG7 0.203 spastic paraplegia 7 isoform 1 PEX1 0.199 peroxin1 NVL 0.198 nuclear VCP-like isoform 2 NVL 0.198 nuclear VCP-like isoform 1 ATAD2 0.193 ATPase family, AAA domain containing 2 ATAD2B 0.189 ATPase family, AAA domain containing 2B YME1L1 0.183 YME1-like 1 isoform 1 YME1L1 0.183 YME1-like 1 isoform 3 KATNA1 0.178 katanin p60 subunit A 1 ATAD1 0.174 ATPase family, AAA domain containing 1 KATNAL1 0.173 katanin p60 subunit A-like 1 KATNAL1 0.173 katanin p60 subunit A-like 1 PEX6 0.172 peroxisomal biogenesis factor 6 KATNAL2 0.168 katanin p60 subunit A-like 2 FIGNL1 0.156 fidgetin-like 1Human BLASTP results (used to prepare the table) | |||
Gene descriptions are from NCBI RefSeq. Search results were obtained with NCBI BLAST and RefSeq entries. When identical proteins are present, the self-match may not be listed first in BLASTP output. In such cases, the table above has been reordered to place it first.
See About the Figures for the scoring system used in the figure above right. The same scoring system was used in the table of BLASTP results.
Guide to the Human Genome
Copyright © 2010 by Stewart Scherer. All rights reserved.
