| Name: CD68 | Sequence: fasta or formatted (327aa) | NCBI GI: 91199550 | |
|
Description: CD68 antigen isoform B
|
Referenced in:
| ||
Other entries for this name:
alt prot [354aa] CD68 antigen isoform A | |||
|
Composition:
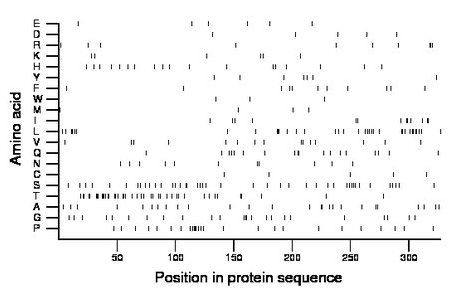
Amino acid Percentage Count Longest homopolymer A alanine 8.0 26 2 C cysteine 1.5 5 1 D aspartate 1.5 5 1 E glutamate 1.8 6 1 F phenylalanine 3.4 11 1 G glycine 7.3 24 3 H histidine 5.5 18 1 I isoleucine 4.0 13 2 K lysine 1.8 6 1 L leucine 10.7 35 3 M methionine 1.2 4 1 N asparagine 3.4 11 1 P proline 8.0 26 4 Q glutamine 5.5 18 2 R arginine 3.1 10 3 S serine 12.8 42 2 T threonine 12.8 42 4 V valine 4.6 15 2 W tryptophan 0.9 3 1 Y tyrosine 2.1 7 1 |
Comparative genomics:
Search single species RefSeq proteins at NCBI
Search summary 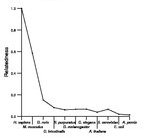
Figure data | ||
Related human proteins:Protein Relative score Description Self-match 1.000 CD68 antigen isoform B CD68 0.977 CD68 antigen isoform A LAMP1 0.111 lysosomal-associated membrane protein 1 LAMP3 0.106 lysosomal-associated membrane protein 3 LAMP2 0.086 lysosomal-associated membrane protein 2 isoform B pre... LAMP2 0.077 lysosomal-associated membrane protein 2 isoform A pre... LAMP2 0.074 lysosomal-associated membrane protein 2 isoform C p... LOC284297 0.066 hypothetical protein LOC284297 MUC21 0.061 mucin 21 MUC2 0.053 mucin 2 precursor FAM65A 0.044 hypothetical protein LOC79567 MUC5AC 0.042 mucin 5AC LOC730474 0.042 PREDICTED: hypothetical protein, partial LOC100294420 0.042 PREDICTED: similar to mucin 2 LOC100132635 0.042 PREDICTED: similar to mucin 5, partial LOC100294470 0.041 PREDICTED: hypothetical protein, partial LOC100131251 0.041 PREDICTED: hypothetical protein LOC100131251 0.041 PREDICTED: hypothetical protein MUC5B 0.041 mucin 5, subtype B, tracheobronchial MUC3A 0.039 PREDICTED: mucin 3A, cell surface associated, parti... MUC3A 0.039 PREDICTED: mucin 3A, intestinal POLR2A 0.039 DNA-directed RNA polymerase II A MUC6 0.039 mucin 6, gastric LOC100133761 0.038 PREDICTED: similar to Mucin-6, partial LOC100130716 0.038 PREDICTED: similar to mucin 11 LOC100130716 0.038 PREDICTED: similar to Mucin-12 MUC12 0.038 PREDICTED: mucin 12 MUC17 0.038 mucin 17 LOC730474 0.036 PREDICTED: hypothetical protein LOC100133408 0.036 PREDICTED: similar to mucinHuman BLASTP results (used to prepare the table) | |||
Gene descriptions are from NCBI RefSeq. Search results were obtained with NCBI BLAST and RefSeq entries. When identical proteins are present, the self-match may not be listed first in BLASTP output. In such cases, the table above has been reordered to place it first.
See About the Figures for the scoring system used in the figure above right. The same scoring system was used in the table of BLASTP results.
Guide to the Human Genome
Copyright © 2010 by Stewart Scherer. All rights reserved.
