| Name: LIN7A | Sequence: fasta or formatted (233aa) | NCBI GI: 4759306 | |
|
Description: lin-7 homolog A
|
Referenced in:
| ||
|
Composition:
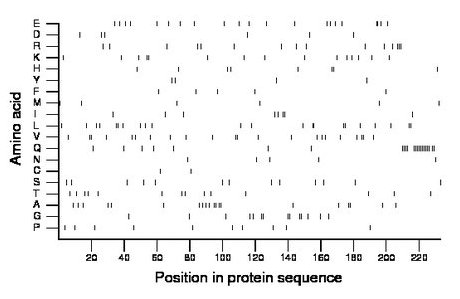
Amino acid Percentage Count Longest homopolymer A alanine 8.6 20 2 C cysteine 0.9 2 1 D aspartate 2.6 6 1 E glutamate 9.0 21 2 F phenylalanine 2.1 5 1 G glycine 6.0 14 2 H histidine 3.4 8 2 I isoleucine 3.4 8 2 K lysine 6.4 15 2 L leucine 9.4 22 2 M methionine 2.6 6 1 N asparagine 2.1 5 1 P proline 4.3 10 1 Q glutamine 9.9 23 10 R arginine 6.4 15 3 S serine 5.6 13 1 T threonine 6.0 14 1 V valine 9.4 22 2 W tryptophan 0.0 0 0 Y tyrosine 1.7 4 1 |
Comparative genomics:
Search single species RefSeq proteins at NCBI
Search summary 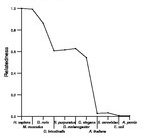
Figure data | ||
Related human proteins:Protein Relative score Description Self-match 1.000 lin-7 homolog A LIN7C 0.681 lin-7 homolog C LIN7B 0.674 lin-7 homolog B DLG2 0.144 chapsyn-110 isoform 3 DLG2 0.144 chapsyn-110 isoform 1 DLG2 0.144 chapsyn-110 isoform 2 DLG3 0.133 synapse-associated protein 102 isoform b DLG3 0.133 synapse-associated protein 102 isoform a DLG4 0.128 post-synaptic density protein 95 isoform 1 DLG4 0.128 post-synaptic density protein 95 isoform 2 DLG1 0.123 discs, large homolog 1 isoform 1 DLG1 0.123 discs, large homolog 1 isoform 2 GOPC 0.114 golgi associated PDZ and coiled-coil motif containing... GOPC 0.114 golgi associated PDZ and coiled-coil motif containin... MPDZ 0.107 multiple PDZ domain protein PTPN13 0.098 protein tyrosine phosphatase, non-receptor type 13 i... PTPN13 0.098 protein tyrosine phosphatase, non-receptor type 13 i... PTPN13 0.098 protein tyrosine phosphatase, non-receptor type 13 i... PTPN13 0.098 protein tyrosine phosphatase, non-receptor type 13 is... PDZD11 0.098 PDZ domain containing 11 SNX27 0.098 sorting nexin family member 27 INADL 0.095 InaD-like SCRIB 0.093 scribble isoform b SCRIB 0.093 scribble isoform a SNTB2 0.093 basic beta 2 syntrophin MAGI1 0.093 membrane associated guanylate kinase, WW and PDZ dom... MAGI1 0.093 membrane associated guanylate kinase, WW and PDZ dom... MAGI1 0.093 membrane associated guanylate kinase, WW and PDZ dom... PARD3 0.091 partitioning-defective protein 3 homolog SNTG2 0.091 syntrophin, gamma 2Human BLASTP results (used to prepare the table) | |||
Gene descriptions are from NCBI RefSeq. Search results were obtained with NCBI BLAST and RefSeq entries. When identical proteins are present, the self-match may not be listed first in BLASTP output. In such cases, the table above has been reordered to place it first.
See About the Figures for the scoring system used in the figure above right. The same scoring system was used in the table of BLASTP results.
Guide to the Human Genome
Copyright © 2010 by Stewart Scherer. All rights reserved.
