| Name: PLA2G4A | Sequence: fasta or formatted (749aa) | NCBI GI: 23943920 | |
|
Description: cytosolic phospholipase A2, group IVA
|
Referenced in:
| ||
|
Composition:
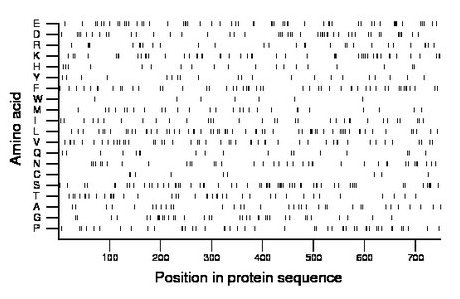
Amino acid Percentage Count Longest homopolymer A alanine 4.7 35 2 C cysteine 1.2 9 1 D aspartate 6.5 49 3 E glutamate 7.9 59 3 F phenylalanine 6.8 51 2 G glycine 4.9 37 3 H histidine 2.5 19 1 I isoleucine 4.7 35 2 K lysine 6.7 50 3 L leucine 8.5 64 4 M methionine 3.7 28 1 N asparagine 5.1 38 2 P proline 6.1 46 2 Q glutamine 2.4 18 2 R arginine 4.0 30 2 S serine 8.4 63 2 T threonine 5.3 40 2 V valine 6.7 50 3 W tryptophan 0.9 7 1 Y tyrosine 2.8 21 1 |
Comparative genomics:
Search single species RefSeq proteins at NCBI
Search summary 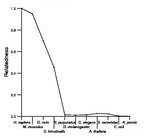
Figure data | ||
Related human proteins:Protein Relative score Description Self-match 1.000 cytosolic phospholipase A2, group IVA PLA2G4F 0.184 phospholipase A2, group IVF PLA2G4E 0.178 phospholipase A2, group 4E PLA2G4D 0.154 phospholipase A2, group IVD PLA2G4B 0.144 phospholipase A2, group IVB JMJD7-PLA2G4B 0.144 JMJD7-PLA2G4B protein PLA2G4C 0.095 phospholipase A2, group IVC isoform 3 PLA2G4C 0.095 phospholipase A2, group IVC isoform 2 precursor [Ho... PLA2G4C 0.095 phospholipase A2, group IVC isoform 1 precursor [Ho... MYOF 0.016 myoferlin isoform b MYOF 0.016 myoferlin isoform a ESYT3 0.013 family with sequence similarity 62 (C2 domain conta... RPH3A 0.013 rabphilin 3A homolog isoform 1 RPH3A 0.013 rabphilin 3A homolog isoform 2 PLCL2 0.013 phospholipase C-like 2 isoform 1 PLCL2 0.013 phospholipase C-like 2 isoform 2 PLCL1 0.012 phospholipase C-like 1 isoform a PLCL1 0.012 phospholipase C-like 1 isoform b PRKCA 0.011 protein kinase C, alpha PRKCG 0.011 protein kinase C, gamma NEDD4L 0.011 neural precursor cell expressed, developmentally dow... NEDD4L 0.011 neural precursor cell expressed, developmentally do... NEDD4L 0.011 neural precursor cell expressed, developmentally do... NEDD4L 0.011 neural precursor cell expressed, developmentally do... PRKCB 0.011 protein kinase C, beta isoform 1 PRKCB 0.011 protein kinase C, beta isoform 2 SYT10 0.010 synaptotagmin X SYT2 0.009 synaptotagmin II SYT2 0.009 synaptotagmin II SYT4 0.009 synaptotagmin IVHuman BLASTP results (used to prepare the table) | |||
Gene descriptions are from NCBI RefSeq. Search results were obtained with NCBI BLAST and RefSeq entries. When identical proteins are present, the self-match may not be listed first in BLASTP output. In such cases, the table above has been reordered to place it first.
See About the Figures for the scoring system used in the figure above right. The same scoring system was used in the table of BLASTP results.
Guide to the Human Genome
Copyright © 2010 by Stewart Scherer. All rights reserved.
