Gene Structure
The tables and figures in this section use a different gene set than that used in most of the text. The set used here was chosen because it derives from the set of transcripts mapped onto the human genome reference DNA sequence. Some of the differences between the mapped transcripts and the cDNA sequences used to predict the RefSeq proteins derive from some members of the latter set not mapping precisely onto the reference genome sequence. A single transcript from each named gene was used to produce the tables and figures in this section. Transcript predictions and some other special cases were excluded (see Notes and References). The retained set was 18,159 transcripts.Gene sizes
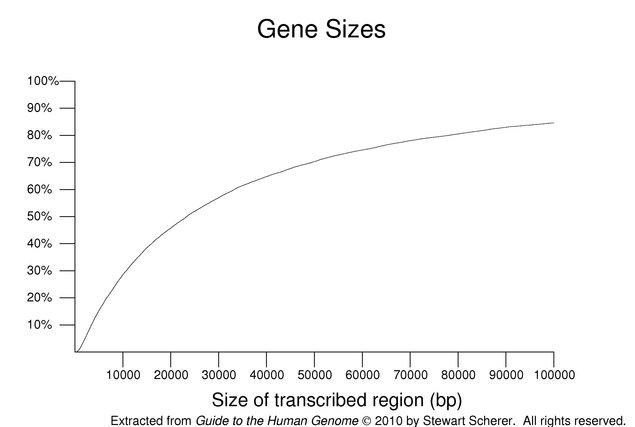
Human genes vary over a wide size range. This is illustrated in the following figure. The size shown is for a single transcript from each gene including its introns; alternate products, in some cases, may span a larger combined region. The plot is cumulative with the y-axis showing the percentile. About 15% of the transcripts span greater than 100 kb of genomic sequence. The median size was 23,329 nucleotides. Genes with no annotated UTR (excluded from this set) tend to be small so these values may be overestimates. These estimates are further complicated by issues relating to the size of the annotated UTRs.
The following table presents some of the largest genes in the human genome. These sizes are from transcribed regions rounded to the nearest 0.01 Mb. For comparison, genes encoding some of the largest proteins have been included. For more information about these genes, see the section listed in the right column. Some of these genes produce a very large number of transcripts and isoforms. Many have functions in the development of the nervous system. Note that links for the gene names point to a single isoform / transcript and that the reference set may include others.
| Largest Genes in the Genome | |||
|---|---|---|---|
| Gene | Size (Mb) | Protein | Section |
| CNTNAP2 | 2.30 | Caspr2 protein | Neurons |
| PTPRD | 2.30 | receptor protein tyrosine phosphatase D | Protein Tyrosine Phosphatases |
| DMD | 2.22 | dystrophin | Muscle |
| DLG2 | 2.17 | chapsyn-110 | Synapses |
| CSMD1 | 2.06 | Additional Interaction Domain Families | |
| MACROD2 | 2.06 | Additional Genes in Development | |
| EYS | 1.99 | Crystallins and Other Eye proteins | |
| LRP1B | 1.90 | lipoprotein receptor family | Lipoproteins |
| CTNNA3 | 1.78 | α catenin 3 | Cadherins and Related Proteins |
| A2BP1 | 1.69 | ataxin 2 binding protein | Cerebellum |
| FHIT | 1.50 | dinucleoside triphosphate hydrolase | Nucleotide Pathways |
| AGBL4 | 1.49 | Carboxypeptidases | |
| FAM190A | 1.47 | ||
| GPC5 | 1.47 | glypican 5 | Protein Glycosylation |
| GRID2 | 1.47 | glutamate receptor | Glutamate |
| NRXN3 | 1.46 | neurexin 3 | Neurons |
| MAGI2 | 1.44 | membrane guanylate kinase | PDZ Domain |
| DPP10 | 1.40 | dipeptidyl peptidase family | Serine Proteases |
| PARK2 | 1.38 | parkin | Neurons |
| IL1RAPL1 | 1.37 | receptor accessory protein | Interleukins and Their Receptors |
| CNTN5 | 1.34 | contactin 5 | Neurons |
| PRKG1 | 1.30 | protein kinase | Cyclic Nucleotides |
| DAB1 | 1.25 | D. melanogaster disabled homolog 1 | Additional Membrane Functions |
| ANKS1B | 1.25 | cajalin 2 | Nucleus and Nucleolus |
| GALNTL6 | 1.23 | Protein Glycosylation | |
| KCNIP4 | 1.22 | Potassium Channels | |
| CSMD3 | 1.21 | Additional Interaction Domain Families | |
| IL1RAPL2 | 1.20 | receptor accessory protein | Interleukins and Their Receptors |
| AUTS2 | 1.19 | Fibroblast Growth Factors | |
| DCC | 1.19 | netrin receptor | Netrins and Laminins |
| GPC6 | 1.18 | glypican 6 | Protein Glycosylation |
| CDH13 | 1.17 | cadherin 13 | Cadherins and Related Proteins |
| ERBB4 | 1.16 | EGF receptor family | Epidermal Growth Factor |
| SGCZ | 1.15 | sarcoglycan zeta | Muscle |
| ACCN1 | 1.14 | cation channel | Sodium Channels |
| CTNNA2 | 1.14 | α catenin 2 | Cadherins and Related Proteins |
| SPAG16 | 1.13 | sperm antigen | Testes and Sperm |
| NRG1 | 1.12 | neuregulin 1 | Neurons |
| OPCML | 1.12 | Neurons | |
| PTPRT | 1.12 | protein tyrosine phosphatase | Protein Tyrosine Phosphatases |
| NRXN1 | 1.11 | neurexin 1 | Neurons |
| WWOX | 1.11 | oxidoreductase | WW Domain |
| NRG3 | 1.11 | neuregulin 3 | Neurons |
| CDH12 | 1.10 | cadherin 12 | Cadherins and Related Proteins |
| DPP6 | ~ 1.10 | dipeptidyl peptidase family | Serine Proteases |
| PARD3B | 1.07 | tight junction protein | PDZ Domain |
| PTPRN2 | 1.05 | protein tyrosine phosphatase | Protein Tyrosine Phosphatases |
| SOX5 | 1.03 | transcription factor | SOX Family |
| NKAIN2 | 1.02 | T cells | |
| Genes for Large Proteins | |||
| Gene | Size (Mb) | Protein | Section |
| TTN | 0.28 | titin | Muscle |
| MUC16 | 0.13 | mucin 16 (CA-125 antigen) | Mucins |
TTN and MUC16 are the largest proteins in the reference set but their genes are only a fraction of the size of the largest genes.
As can be seen in the following figure, in general, these large genes are dispersed along the chromosomes; however, SPAG16 and ERBB4 are very close to each other on chromosome 2. GPC5 and GPC6 are near each other on chromosome 13. Note the absence of large genes on the gene-rich chromosomes 19 and 22.
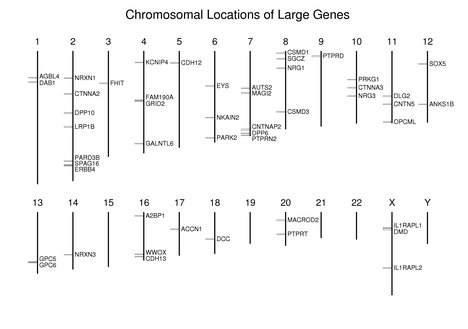
Related proteins are sometimes encoded by genes that have very different sizes. Although utrophin (UTRN) is encoded by a large gene (0.56 Mb), it is only a fraction of the size of dystrophin (DMD, 2.22 Mb). DAB2 is a 0.05-Mb gene, much smaller than DAB1 (1.25 Mb). LRP1 (0.08 Mb) is also much smaller than LRP1B (1.9 Mb).
As seen in the preceding table, two of the neurexins are encoded by very large genes but the third family member, NRXN2, is only 0.12 Mb. A similar situation is found with the roundabout (ROBO) family and several other neuronal protein families (see Neurons). The SNRPN gene in the Prader–Willi imprinted region and the SNRPB gene (see Capping and Splicing) also differ greatly in size but encode similar-sized proteins.
Alternate transcripts and isoforms
A number of genes in the reference set produce a large number of distinct transcripts, often leading to a similarly large number of isoforms. The neurexins (see Neurons) are encoded by extremely large genes that produce an exceptional number of isoforms via alternate splicing. Other genes with very large numbers of transcripts include CMTM1 (chemokine-like protein), COL13A1 (type XIII collagen), CREM (cAMP response modulator), DMD (dystrophin), and PDE9A (cGMP phosphodiesterase).Alternate transcripts are a mechanism for producing isoforms targeted to distinct subcellular compartments. Isoforms are also produced in a tissue-specific manner. HK1 (see Hexokinases and Initial Sugar Metabolism) produces several isoforms from different transcripts, some of which are testes-specific.
Exon / intron structure
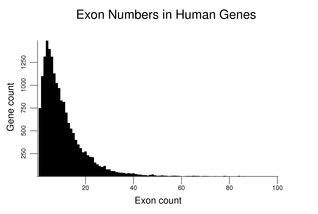
Human genes vary widely in the number and size of their exons and introns. The different sequences found at exon / intron junctions are detailed in the section on Capping and Splicing.The following figure shows the distribution of exon number for human genes. The number of genes with a given exon count is the y coordinate. It uses the gene set described at the beginning of this section. The distribution has a mode of four exons and a median of eight exons. The small number of genes with over 100 exons (see table later in this section) is not plotted.
Many genes are interrupted by an extremely large number of introns. The following table presents some of them. Note that these are not the largest genes in the genome, but they encode many of the largest proteins. Only one transcript from each gene was used. The total number of exons for the gene may be larger than shown. Also, not all transcripts from these genes may be present in the current data sets. The links in the table point to the isoform / transcript with the indicated number of exons.
| Genes with the Most Exons | |||
|---|---|---|---|
| Gene | Exon count | Protein | Section |
| TTN | 312 | titin | Muscle |
| NEB | 150 | nebulin | Muscle |
| SYNE1 | 146 | nesprin 1 | Spectrin and Plectin Families |
| COL7A1 | 118 | collagen type VII | Collagen |
| SYNE2 | 116 | nesprin 2 | Spectrin and Plectin Families |
| HMCN1 | 107 | hemicentin 1 | Additional Immunoglobulin-related Receptors |
| RYR1 | 106 | skeletal muscle ryanodine receptor | Muscle |
| UBR4 | 106 | retinoblastoma-associated protein | RB1 and Related Functions |
| OBSCN | 106 | obscurin | Muscle |
| RYR2 | 105 | cardiac muscle ryanodine receptor | Muscle |
| RYR3 | 104 | ryanodine receptor | Muscle |
| SSPO | 103 | subcommissural organ spondin | Additional Genes in Development |
| MDN1 | 102 | midasin | Nucleus and Nucleolus |
Many proteins are encoded by genes with a single exon or have multiple exons but no introns in their protein-coding regions. Examples are found in the histones, the olfactory and other G-coupled receptors, the interferons, and some members of the FOX family. As seen in the preceding table, large proteins are generally encoded in genes interrupted by many introns. A notable exception is EPPK1 (epiplakin, a protein of over 5000 amino acids) which may lack introns in most or all of its coding sequence.
The following figures show how exon number correlates more with protein size than gene size, notably for genes with many exons.
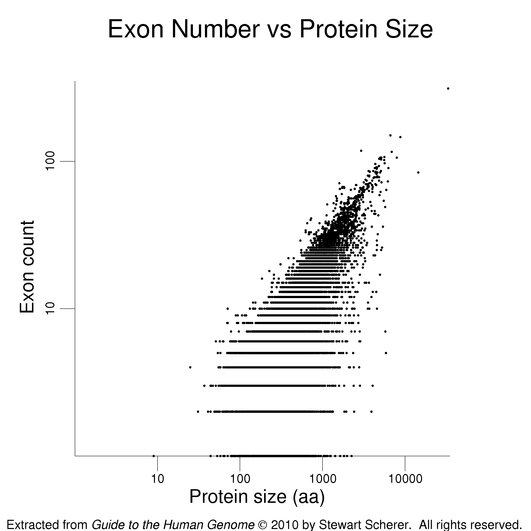
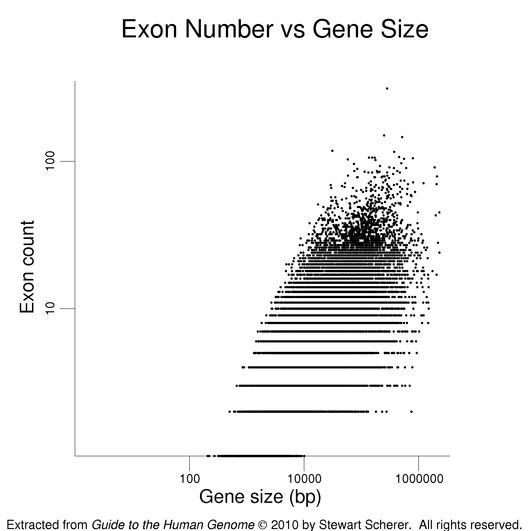
The plot on the left has protein size (log scale) on the x-axis. Gene size (log scale) is the x-axis in the plot at right. Exon number is given on the y-axis (log scale). Single-exon genes are the points along the x-axis. Note the differing scales on the x-axes. The log scales help present the wide data range. The gene set used here is the same as that used in the figure on exon numbers for human genes. Gene size is the span of the transcribed region. The UTRs may be underestimated (see below).
The final plot in this series presents gene size against protein size. A positive correlation is observed.

The same gene / transcript set was used as in the previous figures. The roughly linear set of points at the bottom of the cluster derives from single-exon genes with very small reported UTRs.
Introns vary over a very large size range. The following table uses the same gene set used to produce the figures on exon numbers to present median intron sizes. The table shows data for genes with 2 through 16 exons (1 through 15 introns). The "Gene count" column is the number of examples of that type. Note the greatly increased size for the first introns of genes compared to their subsequent introns and the inreasing size of first and other early introns for genes with many exons.
| Median Intron Sizes | ||||||||||||||||
|---|---|---|---|---|---|---|---|---|---|---|---|---|---|---|---|---|
| Exons | Gene count | Intron | ||||||||||||||
| 1 | 2 | 3 | 4 | 5 | 6 | 7 | 8 | 9 | 10 | 11 | 12 | 13 | 14 | 15 | ||
| 2 | 1099 | 2337 | ||||||||||||||
| 3 | 1315 | 2025 | 1636 | |||||||||||||
| 4 | 1489 | 2733 | 1613 | 1767 | ||||||||||||
| 5 | 1397 | 2471 | 1779 | 1490 | 1562 | |||||||||||
| 6 | 1313 | 2554 | 1910 | 1685 | 1289 | 1412 | ||||||||||
| 7 | 1130 | 2716 | 2013 | 1657 | 1494 | 1437 | 1428 | |||||||||
| 8 | 1023 | 3048 | 2020 | 1752 | 1421 | 1575 | 1303 | 1332 | ||||||||
| 9 | 968 | 3423 | 2232 | 1602 | 1583 | 1563 | 1312 | 1322 | 1224 | |||||||
| 10 | 832 | 4117 | 2312 | 1796 | 1641 | 1547 | 1350 | 1387 | 1312 | 1489 | ||||||
| 11 | 816 | 4163 | 2024 | 1900 | 1623 | 1398 | 1439 | 1267 | 1224 | 1271 | 1424 | |||||
| 12 | 700 | 4334 | 2585 | 1994 | 1597 | 1434 | 1321 | 1291 | 1350 | 1219 | 1253 | 1324 | ||||
| 13 | 586 | 4632 | 2737 | 2129 | 1773 | 1411 | 1613 | 1279 | 1348 | 1432 | 1485 | 1200 | 1292 | |||
| 14 | 524 | 4234 | 2327 | 1727 | 1638 | 1459 | 1434 | 1315 | 1385 | 1209 | 1176 | 1156 | 1287 | 1206 | ||
| 15 | 476 | 4914 | 2450 | 1864 | 1561 | 1471 | 1641 | 1401 | 1306 | 1185 | 1364 | 1291 | 1122 | 1198 | 1166 | |
| 16 | 400 | 4960 | 2912 | 2055 | 1698 | 1508 | 1604 | 1497 | 1252 | 1422 | 1357 | 1318 | 1209 | 1388 | 1318 | 1433 |
The following table lists some of the largest documented introns in the genome. Very large introns are, by necessity, found in large genes. This list overlaps with the list of the largest genes earlier in this section. Note how the genes with the largest introns vary considerably in the number of introns they contain. DPP6, a very large gene spanning an assembly gap, also is likely to contain a very large intron. Many of the genes listed in this table have multiple entries in the reference set for distinct isoforms and transcripts. The links in the following table point to the isoform / transcript with the indicated large intron.
| Genes with the Largest Introns | |||||
|---|---|---|---|---|---|
| Gene | Gene size (bp) | Intron count | Largest intron (bp) | Protein | Section |
| KCNIP4 | 1,220,136 | 7 | 1,097,903 | Kv channel interacting protein | Potassium Channels |
| ACCN1 | 1,143,721 | 9 | 1,043,911 | cation channel | Sodium Channels |
| NRG1 | 1,103,504 | 4 | 955,100 | neuregulin 1 | Neurons |
| DPP10 | 1,402,038 | 25 | 866399 | dipeptidyl peptidase family | Serine Proeases |
| WWOX | 1,113,014 | 8 | 778,855 | oxidoreductase | WW Domain |
| LRRTM4 | 774,654 | 3 | 769,401 | Neurons | |
| HS6ST3 | 748,720 | 1 | 740,920 | heparan sulfate sulfotransferase | Protein Glycosylation |
| GPC5 | 1,468,556 | 7 | 721,292 | glypican 5 | Protein Glycosylation |
| SGCZ | 1,148,420 | 7 | 682,658 | sarcoglycan zeta | Muscle |
| PDE4D | 924,757 | 14 | 677,200 | cAMP phosphodiesterase | Cyclic Nucleotides |
| CNTNAP2 | 2,304,634 | 23 | 657,297 | Caspr2 protein | Neurons |
| FAM155A | 698,205 | 2 | 654,926 | ||
| PCDH9 | 927,503 | 3 | 593,993 | protocadherin 9 | Cadherins and Related Proteins |
| OPCML | 1,117,529 | 7 | 589,253 | Neurons | |
| DLG2 | 2,172,260 | 27 | 576,930 | chapsyn 110 | Synapses |
| RORA | 741,020 | 10 | 550,366 | RAR-related receptor | Nuclear Receptors |
| MACROD2 | 2,057,697 | 16 | 544,980 | Additional Genes in Development | |
| NTM | 966,346 | 7 | 540,674 | neurotrimin | Neurons |
| IL1RAPL2 | 1,200,827 | 10 | 536,480 | receptor accessory protein | Interleukins and Their Receptors |
| FGF14 | 680,920 | 4 | 526,174 | fibroblast growth factor 14 | Fibroblast Growth Factors |
| IMMP2L | 899,238 | 5 | 523672 | Mitochondria | |
| FHIT | 1,502,098 | 9 | 522,714 | dinucleoside triphosphate hydrolase | Nucleotide Pathways |
| FAM190A | 1,474,687 | 10 | 512,577 | ||
| ODZ2 | 979,320 | 28 | 500,512 | Additional Brain Proteins | |
The following table gives exon size data for genes with up to 15 exons using the same genes set desribed for the corresponding intron table. The sizes of the first exons are likely underestimated because of incomplete cDNA clones. The sizes of the final exons are likely overestimated because longer mRNAs are often mapped onto the genome. They may include other poly(A) processing sites that would result in shorter mRNAs. Middle exons have a relatively consistent median size. This number declines modestly as number of exons in the transcript increases. For all middle exons from the full set of selected transcripts, the median value is 123 nucleotides.
| Median Exon Sizes | ||||||||||||||||
|---|---|---|---|---|---|---|---|---|---|---|---|---|---|---|---|---|
| Exons | Gene count | Exon | ||||||||||||||
| 1 | 2 | 3 | 4 | 5 | 6 | 7 | 8 | 9 | 10 | 11 | 12 | 13 | 14 | 15 | ||
| 1 | 749 | 1824 | ||||||||||||||
| 2 | 1099 | 249 | 1537 | |||||||||||||
| 3 | 1315 | 212 | 152 | 1199 | ||||||||||||
| 4 | 1489 | 195 | 129 | 127 | 1153 | |||||||||||
| 5 | 1397 | 184 | 131 | 127 | 131 | 1022 | ||||||||||
| 6 | 1313 | 191 | 129 | 129 | 127 | 124 | 983 | |||||||||
| 7 | 1130 | 202 | 132 | 127 | 127 | 124 | 122 | 1004 | ||||||||
| 8 | 1023 | 192 | 129 | 124 | 125 | 126 | 121 | 123 | 944 | |||||||
| 9 | 968 | 206 | 130 | 128 | 123 | 129 | 126 | 128 | 119 | 922 | ||||||
| 10 | 832 | 196 | 129 | 124 | 122 | 129 | 120 | 124 | 122 | 124 | 1008 | |||||
| 11 | 816 | 199 | 124 | 122 | 121 | 120 | 120 | 122 | 120 | 123 | 119 | 1028 | ||||
| 12 | 700 | 200 | 124 | 113 | 120 | 122 | 117 | 118 | 117 | 122 | 118 | 124 | 1044 | |||
| 13 | 586 | 188 | 118 | 117 | 119 | 118 | 117 | 116 | 120 | 119 | 115 | 121 | 121 | 935 | ||
| 14 | 524 | 193 | 119 | 120 | 112 | 111 | 117 | 111 | 110 | 113 | 121 | 121 | 124 | 115 | 1067 | |
| 15 | 476 | 202 | 122 | 123 | 114 | 123 | 120 | 117 | 125 | 118 | 119 | 121 | 118 | 123 | 124 | 1081 |
Gene size and gene density
As described in the section on the chromosomes, there is considerable variation in gene density among the chromosomes. The following figure uses the same gene set used for the exon correlation figures earlier in this section to examine how gene size varies on the chromosomes (except that the genes in the pseudoautosomal regions of the X and Y were included in the data for both chromosomes instead of being used just once). Median gene size in kb is plotted against kb of sequenced DNA per gene (the x-axis being a reciprocal measure of gene density).
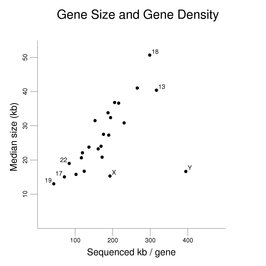
A clear trend is seen where increased gene density (shown here as less sequenced DNA per gene) is associated with a decrease in gene size. The increased gene density is not simply similar-sized genes being closer to each other. The genes still occupy only a fraction of the DNA of the chromosomes (even if predicted genes were added to the set). The X and Y chromosomes and the autosomes with the highest and lowest gene densities are labeled. A notable exception to the trend is seen with the Y chromosome (and to a lesser degree with the X chromosome). The Y chromosome has relatively few genes compared to the other chromosomes.
CpG islands
Although the CpG dinucleotide is generally found at lower frequencies than expected based on base composition, there are regions of the genome called CpG islands where the frequency of this dinucleotide is relatively higher. CpG islands are often located near the starts of mRNAs.
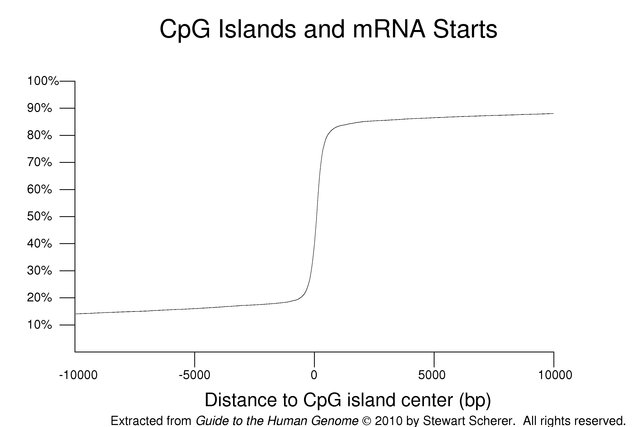
The preceding figure is a cummulative plot of the distances from the center of the nearest CpG island to 5' ends of the transcripts mapped onto the reference genome (selected as before but also excluding genes assigned to chromosome fragments with no CpG island). Negative distances indicate an upstream relative location. Almost 61% of the selected transcripts have their starts within a CpG island. As can be seen in the figure, an even higher fraction of genes has RNA starts close to strictly defined CpG islands. The distribution has very long tails. For comparison, the equivalent calculation for mRNA 3' ends has a relatively flat distribution (not shown).
Notes and references
Many references and other information for individual genes can be found in the RefSeq entries linked via the pages for the proteins mentioned in this section. A table of these entries (with the corresponding gene identifiers) and a collection of their sequences also are available.The gene information for this section is based on the release 37.1 reference genome sequence and the NCBI Map Viewer tables. The size of DPP6 is an estimate as it spans a gap in the assembly. The CpG islands used to prepare the figure were those defined as "strict" in the genome annotation.
The transcript set used to prepare the figures and tables was constructed from the set of transcripts in the Map Viewer tables. For each named gene, only one transcript with a largest encoded protein (in amino acids) was used. If a gene had multiple transcripts encoding proteins of that size, one with the most exons was retained. Transcript predictions were excluded. Similarly, genes reported with no untranslated region were also generally excluded (many of these were olfactory receptor genes). The retained set had 18,159 transcripts. It also excluded a small number of ambiguously placed transcripts and a few genes that span gaps in the assembly.
See also the additional reading for this chapter.
Guide to the Human Genome
Copyright © 2010 by Stewart Scherer. All rights reserved.
