Chromosomes and DNA
Chromosome sequences
Although the human genome sequence is nearly complete, some chromosomal regions remain unsequenced. For example, large low-complexity regions are replaced with blocks of Ns corresponding to their estimated sizes. The tables in this section are based on the reference sequences from build 37.1 of the human genome sequence. The assembled sequences of the 24 human chromosomes total 3,095,677,412 bases (including the blocks of Ns). The Y chromosome has by far the lowest sequenced fraction. In the calculations used to make the following table, single-base ambiguities are included in the unsequenced fraction, which totals 234,350,281 bases. The mitochondrial genome and a small amount of other sequence data not precisely located on the chromosomes were excluded from these totals. Note that the estimated size of chromosome 21 is smaller than that of 22 and in the current reference assembly, chromosome 19 is smaller than 20.
          Chromosome   Sequenced   Unsequenced   Total size     Percent
                         (Mb)          (Mb)        (Mb)        sequenced

              1          225.3         24.0        249.3         90.4
              2          238.2          5.0        243.2         97.9
              3          194.8          3.2        198.0         98.4
              4          187.7          3.5        191.2         98.2
              5          177.7          3.2        180.9         98.2
              6          167.4          3.7        171.1         97.8
              7          155.4          3.8        159.1         97.6
              8          142.9          3.5        146.4         97.6
              9          120.1         21.1        141.2         85.1
              10         131.3          4.2        135.5         96.9
              11         131.1          3.9        135.0         97.1
              12         130.5          3.4        133.9         97.5
              13          95.6         19.6        115.2         83.0
              14          88.3         19.1        107.3         82.2
              15          81.7         20.8        102.5         79.7
              16          78.9         11.5         90.4         87.3
              17          77.8          3.4         81.2         95.8
              18          74.7          3.4         78.1         95.6
              19          55.8          3.3         59.1         94.4
              20          59.5          3.5         63.0         94.4
              21          35.1         13.0         48.1         72.9
              22          34.9         16.4         51.3         68.0
              X          151.1          4.2        155.3         97.3
              Y           25.7         33.7         59.4         43.2

            Total       2861.3        234.4       3095.7         92.4
The following figure shows the locations of unsequenced genomic segments that are 1 kb or longer. Segments 1 Mb or longer are labeled with their sizes (rounded to the nearest 0.1 Mb). A number of adjacent unsequenced regions are merged in the figure because of its resolution. More detail can be seen by selecting the figure for an enlarged version but some neighboring unsequenced regions are still not resolved.
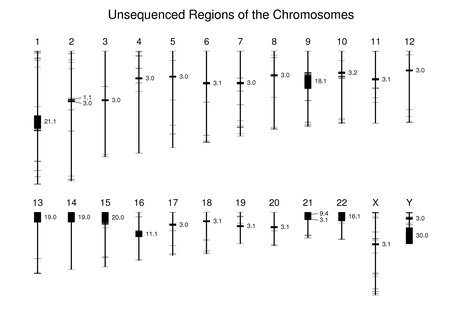
The large regions at the ends of chromosomes 13, 14, 15, 21, and 22 are the locations of the nucleolus organizers containing genes for ribosomal RNAs. These and many other unsequenced regions contain large numbers of repeats and variants of known human DNA sequences. Some are centromeric heterochromatin.
Base composition
The following table gives the nucleotide and dinucleotide frequencies for the reference genome sequence and for gene-rich chromosome 19 alone. Because certain chromosomal regions are not sequenced, these numbers only approximate the composition of the complete chromosomes.
                             Nuclear genome    Chromosome 19
                              fraction (%)      fraction (%)
                         A         29.53            25.79
                         G         20.46            24.21
                         C         20.45            24.15
                         T         29.57            25.85

                         AA         9.77             7.58
                         AG         6.99             7.45
                         AC         5.03             5.08
                         AT         7.73             5.68
                         GA         5.93             6.14
                         GG         5.21             7.27
                         GC         4.27             5.70
                         GT         5.05             5.10
                         CA         7.25             7.57
                         CG         0.99             1.89
                         CC         5.21             7.25
                         CT         7.00             7.44
                         TA         6.57             4.50
                         TG         7.27             7.60
                         TC         5.94             6.12
                         TT         9.80             7.64
Both the nucleotide and dinucleotide frequency data show minimal
strand bias at the chromosome and genome levels.
Gene-rich chromosome 19 has a much higher G+C fraction and almost
double the frequency for the CG dinucleotide.
Highly repeated DNA sequences
A large fraction of the genome consists of highly repeated sequences derived from mobile elements. These are described separately in the section on transposons. A second class of repeated sequences is composed of the genes and pseudogenes from the various noncoding RNAs (including the rRNA genes).Another class consists of satellite DNAs. The α satellite is found at centromeres. It is built from a nominal 171-bp repeat unit. Chromosome-specific variants have been described. The β satellite is a shorter sequence, often 68 bp. 69-bp β repeats have also been described. The consensus repeat unit for the longer γ satellite is 220 bp. See the Notes and References at the end of the section for examples of the satellite sequences.
The human genome contains many repeats of shorter DNA sequences. For example, classical satellite III is built from repeats and variants of the sequence ATTCC.
Gene density
Gene density varies greatly among the chromosomes. The Y chromosome has the lowest gene density but its gene density value is less extreme when only the sequenced fraction of the chromosome is considered. Some of the smaller chromosomes, notably chromosome 19, have very high gene densities. The following table provides gene density data using the protein-coding genes mapped on the chromosome sequences (see Notes and References).
             Chromosome  Size   Sequenced   Genes   Genes /   Genes /
                         (Mb)      (Mb)              Mb    sequenced Mb

                   1     249.3     225.3     1959    7.86      8.70
                   2     243.2     238.2     1184    4.87      4.97
                   3     198.0     194.8     1029    5.20      5.28
                   4     191.2     187.7     721     3.77      3.84
                   5     180.9     177.7     835     4.62      4.70
                   6     171.1     167.4     1002    5.86      5.99
                   7     159.1     155.4     855     5.37      5.50
                   8     146.4     142.9     638     4.36      4.47
                   9     141.2     120.1     748     5.30      6.23
                  10     135.5     131.3     714     5.27      5.44
                  11     135.0     131.1     1236    9.16      9.43
                  12     133.9     130.5     987     7.37      7.56
                  13     115.2      95.6     305     2.65      3.19
                  14     107.3      88.3     577     5.37      6.54
                  15     102.5      81.7     547     5.33      6.70
                  16      90.4      78.9     783     8.67      9.93
                  17      81.2      77.8     1111   13.68     14.28
                  18      78.1      74.7     257     3.29      3.44
                  19      59.1      55.8     1332   22.53     23.87
                  20      63.0      59.5     518     8.22      8.71
                  21      48.1      35.1     213     4.43      6.07
                  22      51.3      34.9     418     8.15     11.98
                   X     155.3     151.1     806     5.19      5.33
                   Y      59.4      25.7     65      1.09      2.53
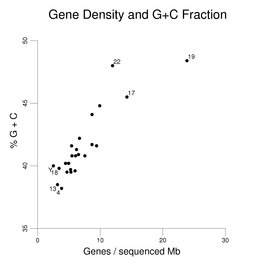
The following figure shows how gene density
correlates with the G+C content of the sequenced regions of the chromosomes.
The values from the right-hand column in the table above are plotted
on the x-axis of the figure.
The three chromosomes with the highest gene densities and the
four chromosomes with the lowest gene densities are labeled.
Mitochondrial genome
The current reference mitochondrial genome sequence is 16,568 bases (see Notes and References). As shown in the following table, the mitochondrial genome has a very different base composition than the chromosomes. It also shows very strong strand bias.
                               Mitochondrial genome
                                   fraction (%)
                              A       30.93
                              G       13.09
                              C       31.27
                              T       24.71
The following figure shows the locations of the genes on the circular mitochondrial genome. The tRNA genes have been omitted. RNR1 and RNR2 are the small and large rRNA genes, respectively. All of the genes shown except ND6 are transcribed clockwise as presented in the figure. Some of the coding regions overlap.
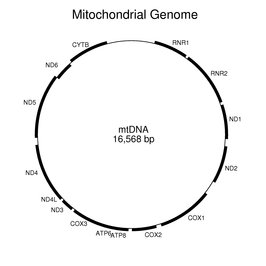
A large number of sequences in the nuclear genome are related to fragments of the mitochondrial genome.
The mitochondrially encoded proteins are all described in the Oxidative Phosphorylation section. There are two sets of protein sequences for these genes in the reference set. The second set derives from the mitochondrial genome of Homo sapiens neanderthalensis (see Notes and References).
Notes and references
Release 37.1 of the human genome sequence includes multiple assemblies of the chromosomes from different source data. The tables on chromosome size and base composition are based solely on the 24 reference human chromosome sequences.
GI:36349 is a consensus sequence of the α satellite. GI:337814 is an example of the 68-bp β satellite repeat. GI:1223742 includes γ-type satellite sequences.
The gene set used for the gene density calculations is that mapped onto the reference genome. Protein-coding regions from mobile elements were generally excluded. Similarly, rearranging genes such as those for antibodies and the T-cell receptors were not included. A small number of the protein-coding sequences assigned to specific chromosomes but not located on the reference sequences for the intact chromosomes also have been excluded. Predicted genes were not included in these data. Note that the gene set used here differs from the RefSeq set used in most of the text. When the predicted genes are removed from the RefSeq set, the differences between the two gene sets are relatively small.
The map and table for the mitochondrial genome is based on the NCBI GI:251831106 entry. This reference mitochondrial genome sequence, as reported, is 16,569 bases. It contains a single N at position 3107. This position is not ambiguous but was included to preserve coordinates relative to an earlier version of the sequence that had an additional base at that location.
For the Homo sapiens neanderthalensis mitochondrial genome, see GI:196123578. Its genome size is 16,565 bases. The proteins in the reference set from its genome are not cited in the text nor used in calculations for the figures. They do appear as alternate products on the pages for the corresponding proteins encoded in the reference mitochondrial genome.
See also the additional reading for this chapter.
Guide to the Human Genome
Copyright © 2010 by Stewart Scherer. All rights reserved.
